17 min read. ·Jun 3, 2026
A multi-trillion-dollar industry built on a confusion between two kinds of intelligence — and what a new physics of meaning changes about that
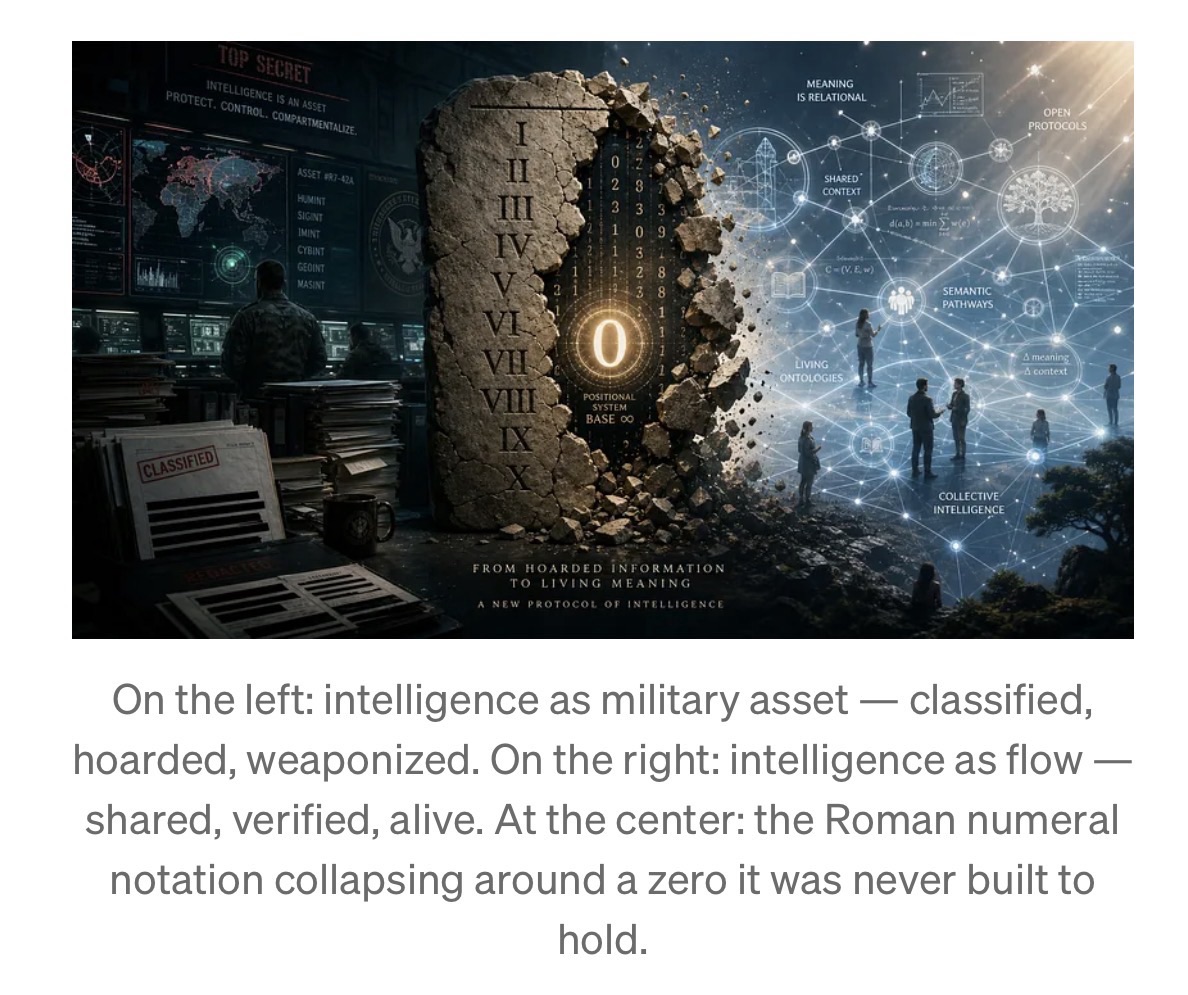
“Artificial Intelligence” contains two misnomers. Intelligence was borrowed from the military definition: information hoarded as competitive advantage. Piaget’s definition — the one Yann LeCun himself cited — is the opposite: intelligence is how you behave when you don’t know, an ephemeral flow through a gap-closing network, not an accumulating asset. Artificial fails because you cannot simulate a flow inside a single frozen system.
The real problem is structural: current AI has no zero of meaning, no way to represent verified absence. This is the Roman numeral problem applied to knowledge — a notation that forces every query to produce an answer, even when the honest answer is I don’t know.
The fix is not a better model. It is a missing protocol layer — the TCP/IP of meaning — that introduces a new physics of meaning: verified knowledge has semantic gravity, ignorance has none, and a system that knows where its light cone of care ends can finally behave differently at that boundary. That protocol, built on Berners-Lee’s Semantic Web, Burgess’s Semantic Spacetime, and Peirce’s semiosis, connected by cryptography, is the Semiotic Web.
When it exists, intelligence stops being something the strong hoard against the weak — and becomes what it always was: a flow that benefits the whole network precisely because no single node can own it.
Something unexpected happened while searching for the right frame to explain a three-year investigation into what intelligence actually is.
A social media post from Yann LeCunappeared. LeCun — the Turing Award winner, the most prominent voice arguing publicly that large language models are a dead end — was sharing his admiration for the Swiss developmental psychologist Jean Piaget, describing Piaget’s work as a direct influence on his own approach to machine intelligence. The quote he was amplifying read:
“Intelligence is not what you know, but how you behave when you don’t know.”
The reason this stopped the investigation cold has nothing to do with LeCun’s specific architectural proposals. It has to do with what the quote implies about the industry LeCun helped create — and about why its very name contains not one misnomer but two.
The Word “Intelligence” Has Two Meanings. The Industry Chose the Wrong One.
There is a word that intelligence agencies, military strategists, and geopolitical analysts use constantly. It means: information hoarded to gain competitive advantage over those who have less. You intercept enemy communications. You recruit sources behind enemy lines. You protect your own secrets while mining theirs. The goal is asymmetry — knowing more than the other side knows, and exploiting that gap.
This is military intelligence. And it is the diametrically opposite meaning to the one Piaget defined.
Military intelligence is a stock. You accumulate it, protect it, weaponize it. The more you hold relative to your adversary, the more power you wield. The entire competitive logic of nations rests on this version of the word.
The confusion between these two meanings is not incidental to the story of Artificial Intelligence. It is the story. The driving forces that funded early AI research — military institutions, defense contractors, intelligence agencies — were intelligence agencies in the military sense. They wanted systems that could process more information, faster, than any human adversary. They wanted the informational asymmetry of knowing more. They called it intelligence because that is what they were in the business of producing.
And so an entire field was named, funded, and shaped around the military definition — while borrowing the prestige of the cognitive one.
The result is a Ptolemaic confusion: treating intelligence as something that can be accumulated, concentrated, and deployed as an asset — as if it were oil or uranium, a resource whose possession confers power. A trillion-dollar industry has been built on this premise. And the premise, as Piaget’s definition makes clear, is precisely backward.
The First Misnomer: “Intelligence”
Read Piaget’s sentence as a mathematician would read a formal specification.
Intelligence is not what you know. This eliminates, by definition, every system whose fundamental design is to know things — to accumulate, index, compress, and retrieve. A system trained on all digitized human knowledge, designed from the ground up to always produce an answer, has under this definition precisely zero intelligence. Not low intelligence. Not imperfect intelligence. The derivative of gap-closure on a system permanently in a state of apparent knowing is zero, regardless of its parameter count.
How you behave when you don’t know. This requires, as a precondition, that the system has the structural capacity to recognize it doesn’t know. A gap must be felt before it can be closed.
The Four Stages of Competence model — formalized by Martin Broadwell in 1969 and widely circulated by Noel Burch at Gordon Training International in the 1970s — makes this visible with precision. The model describes how any skill is actually learned:
- Unconscious Incompetence — You don’t know what you don’t know.
- Conscious Incompetence — You know that you don’t know.
- Conscious Competence — You know, but it requires deliberate effort.
- Unconscious Competence — You know without thinking. Fluency. Second nature.
Intelligence exists only in the gap between stages 2 and 3 — in Michael Levin’s biological definition, intelligence is a flow, not a stock, and that flow only moves when a gap is felt and acted upon. Stage 4produces something enormously valuable — mastery, fluency, reliability, speed — but zero intelligence. Kahneman called this System 1: pattern recognition operating below the threshold of deliberate effort. Every AI system in production today is the most powerful Stage 4 engine ever built.
This explains something most people notice about gifted polyglots but can never quite articulate. Someone who speaks ten languages fluently is not necessarily more intelligent than someone who speaks two. Learning each language demanded tremendous active intelligence — to feel the gaps in grammar, to notice where intuition failed. But once crystallized into fluency, it transformed into communication skill. Spectacular, useful, but no longer intelligent in Piaget’s sense. You can ask the same confused question in ten languages and still have no idea how to answer it.
This is precisely what any AI system does — at civilizational scale. Trained on massive, redundant information, it has crystallized patterns of human expression into Stage 4 fluency. It cannot understand anything that requires recognizing a gap it has no structural way to feel.
The Second Misnomer: “Artificial”
The word “artificial” implies a conscious decision to simulate something that exists naturally. But intelligence, properly defined, is not a property of a system. It is a flow through a network — and therefore cannot be simulated inside a single system at all.
When Einstein developed General Relativity, intelligence wasn’t located inside his skull. It was flowing through a network: Grossmann’s mathematics, the anomaly of Mercury’s perihelion, the resistance of colleagues in Zurich, the thought experiment of the falling elevator, Eddington’s eclipse expedition, the entire decade of productive friction with a reality that kept refusing to fit the existing frame. The intelligence was the gap-closing. It evaporated the moment each gap closed.What remained was General Relativity — no longer intelligence, but verified knowledge crystallized into a form others could use without re-deriving it.
There is nothing artificial about that process. It is the most natural thing there is. And the systems carrying the name “Artificial Intelligence” don’t simulate it. They are its most sophisticated archival product — extraordinary libraries that emerged from an intelligent process and make the results of that process accessible to everyone. Remarkable. Genuinely transformative. But not intelligence. An archive of intelligence’s outputs.
The very fact that we call the creators of AI and Deep Learning its “Godfathers” reveals the misunderstanding in its purest form. Godfathers originate, control, and concentrate. Intelligence, by Piaget’s definition, is ephemeral, distributed, and shared. The word chosen for the founders of the field is the word of the military definition — of power, hierarchy, and concentrated authority. That is not an accident. It is the cultural trace of which version of “intelligence” was running the show when the field was named.
The preprint The Einstein Test and Beyond, written with cognitive scientist Tony McCaffrey, uses a more accurate term for current AI systems: Stochastic Guessing Engines. Not an insult — a technical specification. These systems guess brilliantly, statistically, from more accumulated pattern than any previous system. And that specification carries a constraint that no amount of engineering within the current paradigm can remove.
Why LeCun Is Right, and Where It Stops
Yann LeCun left Meta in late 2025 after the company reorganized toward closed, product-driven development and cut hundreds of researchers from FAIR. He launched AMI Labs with a billion-dollar seed round, betting that the path to real machine intelligence requires world models grounded in physical reality — systems that learn the statistics of reality, not just the statistics of words. His core critique is structurally correct: a system trained on text cannot develop genuine understanding of the physical world. Language is discrete, finite, and thin. Physical reality is continuous, multidimensional, and dense with information that no text corpus can contain.
The Piaget quote LeCun shared is the best single-sentence statement of why his direction is right. And it also points precisely to the place where his solution does not yet go far enough.
LeCun’s JEPA world models learn to predict the future state of their environment in abstract latent space rather than at the pixel level. Instead of reconstructing what the world looks like, they predict what it means— learning structured representations of physical causality. This is a meaningful advance. But the latent space in which JEPA models predict has no stable address. A concept — gravity, proximity, containment — exists at different coordinates in every model, every version, every training run. Without stable addresses, a world model’s predictions remain sealed inside a private coordinate system that no other system can independently verify, challenge, or build upon. The world model learns what the world probably looks like. It cannot learn what the world verifiably is in a form that survives contact with other agents. It predicts brilliantly — in isolation. And isolated prediction is not intelligence. It is the most sophisticated Stage 4 pattern-matching ever conceived.
A hoarded asset has zero intelligence. Its use as a competitive weapon produces actions that cannot be called intelligent — because intelligence requires the capacity to feel a gap, and a frozen system, sealed inside its probability manifold, can only feel the gravitational pull of what it has already seen. Everything else is weightless. Everything else is outside the light cone.
The Roman Numeral Problem
The notation problem that runs through all of this has a precise analogy in the history of mathematics — one worth holding before reaching the structural fix.
Try dividing 1 by 3 in Roman numerals.
You cannot write the result. Not because Roman numerals lack symbols for small quantities — they have I, which can be subdivided in principle. The problem is that the system has no placeholder. No concept of a position that carries structural meaning through its emptiness. The result of 1 ÷ 3 is the repeating decimal 0.333… — a number defined precisely by the relationship between a non-zero numerator and its infinite positional expansion. Without zero as a structural entity, without a symbol meaning “this position is empty and that emptiness is meaningful,” you cannot write 0.333. You cannot represent the difference between 10 and 100.
Every Roman numeral calculation has to be performed against the grain of the notation itself — accumulating marks and hoping the pattern yields the answer. The Romans were not unintelligent. The notation simply made certain classes of operation structurally unavailable — not difficult, not slow, but impossible to conceive.
When the Hindu-Arabic positional system arrived in Europe, carrying the zero that Indian and Arab mathematicians had formalized, it did not merely accelerate arithmetic. It introduced a substrate in which operations previously impossible became structurally natural: fractions, algebra, calculus, the mathematical basis of modern physics. Not because zero represented some new object in the world. Because zero gave the notation the capacity to represent the absence of a value as a structural entity — a placeholder whose presence in a specific position carries precise meaning.
Current AI is performing Roman-numeral arithmetic with meaning. The Softmax function that every transformer uses is formally identical — not loosely analogous, identical — to the Boltzmann distribution in statistical thermodynamics: an equation that always redistributes probability mass across all possible outputs, always summing to one, always producing a non-zero response for every query, including queries for which no verified answer exists. The system must produce something. It has no structural zero. Hallucinations are not a bug to be patched. They are the architecture faithfully executing its specification.
The Light Cone of Care
There is a concept from physics that makes the weight of ignorance unexpectedly precise.
SIn Einstein’s relativity, only events within your past light cone — events close enough in space and time that light could have reached you from them — can influence you. Everything outside that cone is, by the laws of physics, causally disconnected from your present. It cannot act on you. It has no gravitational pull on your trajectory.
The same principle applies to meaning. An AI system cannot care about what it doesn’t know exists. Not because of a programming limitation. Because ignorance, structurally, has no weight. An unverified concept — a fact no training example contained, a relationship no corpus recorded, a gap the system has no structural representation for — exerts zero gravitational pull on the system’s outputs. It cannot close a gap it cannot perceive. It cannot feel the absence of something that has never entered its light cone of verified knowledge.
This is what makes the military targeting example not merely tragic but architecturally inevitable. The system that guided the strike had no verified record that the building’s use had changed. The school was outside its light cone of care. And because ignorance has no weight, the absence generated no signal, no hesitation, no structured refusal. The system produced a confident answer in the only direction its probability mass was pulling it — toward the pattern it had learned — with no capacity to flag what it didn’t know it didn’t know.
The Dramatic Cost of the Wrong Definition
Consider how state-of-the-art AI systems are currently used to target military threats. The system processes satellite imagery, signals intelligence, and pattern-of-life data. It identifies a building as a high-probability target. An action follows.
But the system could not know that the use of the building had changed. A school had moved in. The system had no way to register that absence — no structural representation of I don’t know what this building is being used for today. No gap to feel. No uncertainty to flag. And because the system is too opaque — formally, verifiably, mathematically opaque — to audit after the fact, no one can trace the chain of reasoning that led to the outcome. No agent is accountable. The architecture made accountability impossible by design.
This is not a failure of a particular system or operator. It is the direct operational consequence of treating intelligence as a stock of hoarded information deployed for competitive advantage — rather than as a flow through a network that knows what it knows, knows what it doesn’t know, and behaves differently in each case. A system that can say I don’t know is not weaker than one that always answers. It is, by Piaget’s definition, the only one that can be called intelligent.
A New Physics of Meaning
The fix is not a better model. It is a different notation — one built on three intellectual foundations that have never previously been connected by cryptography.
Tim Berners-Lee’s 1998 vision for the Semantic Web described, with architectural precision, what the web should have become: not a network of documents, but a network of meaning — where concepts, not just pages, would be linked, shared, and verified across systems, independently of any corporation, platform, or central authority. The vision stalled because it required human-curated ontologies and had no scalable grounding mechanism. The direction was exactly right. The substrate was missing.
Mark Burgess’s Semantic Spacetime and Promise Theory provide that substrate’s geometry. Burgess showed that every possible semantic relationship can be represented using just three meta-types — Things, Events, and Concepts — and four relationship axes: Proximity (verified similarity), Sequence (causal-temporal ordering), Containment (hierarchical membership), and Property (grounded attribute anchoring). This (3,4) system is not an approximation of semantic structure. It is the minimum structure in which meaning can be represented without superposition. Twelve parameters replace thousands of embedding dimensions. Where a transformer encodes gravity as a direction in a 4096-dimensional vector space — a direction that shifts with every retraining — Semantic Spacetime encodes it as a unique, stable, non-superposed position navigable from any other concept through four deterministic axes.
C.S. Peirce, the father of semiotics, formalized in the 19th century what the other two leave incomplete: meaning is not a two-party relationship between a sign and what it refers to. It requires an irreducible triad — the Sign, the Object, and the Interpretant: the specific, situated observerwhose understanding is transformed by the sign in a specific context. Every architecture that processes signs in relation to other signs — no matter how sophisticated — remains trapped in a dyadic prison. The Interpretant, the observer, is absent. Without the observer, there is no pragmatics. Not approximately. Structurally.
The Notation Inversion connects all three through cryptography. It assigns each concept a Canonical Concept Identity (CCI)— the SHA-256 hash of its canonical description, a mathematical property of the concept itself, the way π is a mathematical property of circles. A hospital in Geneva, a research lab in Nairobi, and a device in São Paulo independently computing the CCI for any concept arrive at the same 32-byte address without coordination, without a shared model, without a central registry. The address exists in mathematical space before anyone computes it. Computing it is discovering it.
This is the Arabic-numeral move: the zero of meaning now exists. A concept address with no verified observations attached is not a guess. It is an empty address — a structural zero. The system knows exactly what it does not know.
Each verified observation — who noticed what connection between which concepts, when, with what evidence — is recorded as a Contextual Truth Instance: a cryptographic record that introduces Peirce’s Interpretant into the architecture as a structural participant, not a philosophical afterthought. And as multiple independent observers verify the same connection, something emerges that has a precise physical analogy: Semantic Gravity — a gravitational weight that pulls all future reasoning in the network toward well-established connections, and away from unverified alternatives.
This architecture is not metaphorically but formally isomorphic to Einstein’s General Relativity. Just as mass curves spacetime and spacetime curvature guides the motion of objects through it, verified meaning curves Semantic Spacetime and Semantic Gravity guides the cognitive motion of any agent through the network of concepts. The concepts inside a system’s light cone of verified knowledge have weight. The concepts outside it are weightless — and the system knows they are weightless, which is precisely what lets it behave differently when it reaches that boundary.
Together, these primitives form the Tokum— the first cryptographically secure, triadically complete unit of meaning. The Semiotic Web built from Tokums is the TCP/IP of meaning: the protocol layer beneath applications, beneath models, beneath platforms. It does not replace LLMs or world models. It provides the shared infrastructure that makes them interoperable at a level they cannot independently achieve — just as TCP/IP did not replace the applications running on the internet.
When the Semiotic Web receives a query for which no verified Contextual Truth Instance exists, it does not produce a low-confidence distribution. The address is empty. The system halts and returns a structured zero: “This is the address of the concept you are asking about. No verified observation has been recorded there.” The school is now visible — not as a positive presence, but as a meaningful absence. The system’s light cone of care has a defined boundary, and it knows where that boundary is.
This is Piaget’s definition, made operational. This is also what makes the school visible to the targeting system — not as a technical patch, but as a structural property of the architecture.
The Paradox of Competence
For over three years, the difficulty has not been technical. It has been epistemological.
How do you tell Turing Award recipients, Nobel laureates, and Field Medal winners that the concept at the center of theindustry they built is neither artificial nor intelligent — without it sounding like an insult, when it is, in the deepest sense, a recognition?
Because the people who built these systems were genuinely intelligent. Enormously so. Real intelligence — gap-closing intelligence, Piaget-defined intelligence — was flowing through their work as they pushed against every known boundary, discovered features no one had named, revised intuitions under the pressure of anomalous results. The achievements are real. The technology is genuinely transformative.
But the Four Stages of Competence reveal the paradox exactly. The moment those gaps closed, the intelligence that had been flowing crystallized into mastery — Stage 4. And from inside Stage 4 mastery, the systems look like intelligence. They produce outputs indistinguishable, in most contexts, from what an intelligent process would produce.
What those systems cannot do is know that they cannot know. And neither can the experts who built them, as long as they remain inside Stage 4 competence about the nature of intelligence itself. This is not a criticism of their intelligence. It is the confirmation that intelligence doesn’t exist as an asset. It is always an ephemeral property of a substrate-independent network — and the network that needs to close this particular gap is wider than any single field or institution.
From Artificial Intelligence to Agapistic Influence
If both words in “Artificial Intelligence” are misnomers, what should we call it instead?
The Einstein Test and Beyond proposes a replacement that keeps the initials while reversing the meaning entirely: Agapistic Influence.
The term draws on C.S. Peirce — the same philosopher whose semiotic triad underlies the architecture above — and his concept of agapism: evolutionary love as a pulling force toward homeostatic balance, coherence, and the flourishing of the whole system. Not competition. Not accumulation. Not the hoarding of informational advantage. The opposite: the voluntary sharing of verified meaning across a network of independent agents, each acting to close gaps that benefit the system as a whole, each rewarded in proportion to the verified meaning they contribute — their intellectual provenance permanently embedded in the atomic unit of knowledge they helped create.
In this architecture, the distinction between what biology, humanity, and machines produce as flows of intelligence becomes clear and fully natural — not artificial:
- Intuition and the discovery of obscure features remains exclusively biological, rooted in felt qualities — qualia, stakes, embodied consequence — that no machine can replicate.
- Gap definition — recognizing what is unknown and specifying the desired state — is the strongest human prerogative, the irreplaceable act of framing the question.
- Gap closure — the process through which intelligence flows — becomes the combination of machine-assisted problem-solving using both System 1 and System 2, directed by human and biological intelligence toward the gaps that matter.
The challenge ahead is to convince the entrenched powers that benefit from intelligence in the military sense that what they think will benefit them is producing the opposite. A hoarded asset has zero intelligence. Its use as a competitive weapon destroys the homeostatic conditions on which any healthy system depends. And the opacity that makes it seem powerful makes it impossible to hold accountable when it goes wrong.
If the current illusion of intelligence — in its most anticipated form, an AGI that will overtake everything — can be honestly challenged, the world is in better shape. No army of robots doing all the tasks will benefit humanity as much as the freedom of every individual to set their own goals and be helped to achieve them in a manner that benefits the individual while fully considering and respecting the ecosystem they are part of.
Provided enough people connect and work together on closing that gap, a true revolution of intelligence can emerge — one where sharing knowledge is more valuable than hoarding it, where knowledge retributes its originators in proportion to their verified contributions, where the benefits of new discoveries accelerate toward those who most need them, in a true spirit of Agapism.
Then we will know, for certain, what intelligence actually is.
The author is the initiator of the Tokum Initiative and co-author (with cognitive scientist Tony McCaffrey) of “The Einstein Test and Beyond: The Architecture of the Semantic Zero” Further documentation at tokum.ai.
Article link: https://medium.com/@eric_54205/why-artificial-intelligence-is-neither-artificial-nor-intelligent-6c9ef1ae6994