March 25, 2022 | Article

How to manage—and eventually master—complexity in embedded systems development.
DOWNLOADS
Selling hardware without software is unthinkable in most industries. In recent years, systems that combine hardware and software—that is, embedded systems—have become more complex because they rely on other systems themselves. In this system-of-systems approach, the number of interfaces tends to explode—clear evidence for rising system complexity. A 360-degree perspective on managing complexity can help companies avoid falling into the complexity trap and eventually master complexity.
1. Falling into the complexity trap
As the complexity of systems increases, complexity—that is, dealing with complexity and potentially resolving it—becomes a growing concern. Even with the best intentions, embedded systems can become so complex that their development becomes increasingly risky and prone to delays. To show how organizations can navigate this process, we start with a short perspective on embedded systems and their importance before diving into the root causes of complexity and how to manage it.
The growing importance of embedded systems
An embedded system combines both hardware and software. The use of embedded systems has long been established across industries such as aerospace, automotive, industrial machinery, and consumer electronics. However, recent developments—for example, automation, connectivity, analytics, and the Internet of Things—have moved embedded systems to the center of attention within these industries. To achieve the functionality these new developments require, multiple systems must interact precisely with one another. The key to this interaction usually lies within the software part of an embedded system.
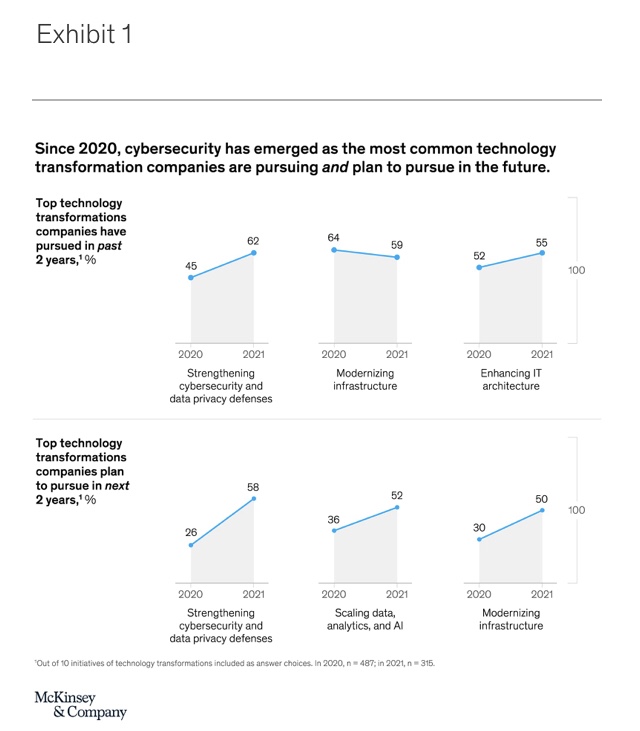
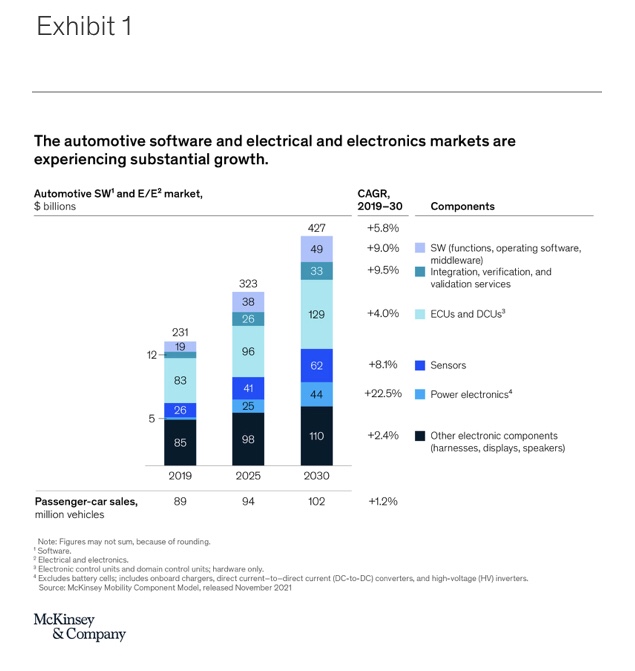
For example, in the automotive industry, embedded software has been used since at least the introduction of the antilock braking system (ABS). Today, automotive embedded software is already a multibillion-dollar market,1 with expected growth rates of roughly 9 percent until 2030 (Exhibit 1). Embedded software is being used in advanced driver-assistance systems (ADAS) and automated driving (AD). In-vehicle infotainment systems are also inconceivable without the use of embedded software.
In the aerospace and defense industry, fly-by-wire systems that automatically control flight operations have been available for decades. Recently, however, system-of-systems approaches have required the coordinated interaction of manned and unmanned aircraft in potentially hazardous situations, dramatically increasing the importance of embedded systems.
The machinery and tools industry is also moving from deterministically controlled systems to creating automated smart tools that are self-optimizing in a closed-loop approach. Embedded software is at the heart of enabling these critical features, too.
From a technical perspective, “embedded systems” refers to the integration of software components, computer hardware, sensors, and actuators into a larger mechanical and electronic system. These systems constitute an active chain in which sensors collect external signals that are processed by control units, which then cause actuators to behave in line with the system’s operating purpose.
Rising complexity within embedded systems
To understand the relevance of complexity in embedded systems, one must first consider complexity drivers. Quite generically, tight integration between individual features of a system drives complexity. Tight integration often entails a large number of interdependencies, which can tremendously complicate embedded system development and maintenance. The following is a nonexhaustive list of drivers of complexity in embedded systems:
- Operational domain and standards or regulation.Embedded systems usually interact directly with the real world by processing sensor data and turning the results into action via actuators. This leads to strict requirements within an embedded system’s operational domain, such as combined real-time and event-driven functionality, safety, reliability, and longevity. Safety and realiability requirements specifically are enforced by regulation and other industry standards (for example, IEC 61508 for functional safety in general or DO 178 and ISO 26262 for safety in aerospace and automotive industries, respectively). To meet these standards, systems may become more complex than they were originally designed to be.
- Increased automation. The trend toward increased automation leads to a growing need for modern technologies such as machine learning and closed-loop control. These technologies require data from multiple parts of a system to be processed and then combined in one overarching target function, such as predicting maintenance needs in manufacturing systems or optimizing process performance. More automation can necessitate more complexity.
- Rising connectivity. The connectivity trend means that embedded systems are increasingly able to exchange data with their environment. This has multiple implications. First, cybersecurity becomes mandatory, whether for control systems in industrial automation or for the automotive industry, where it is enforced via the UNECE regulation. Second, the availability of remote access and updating means that the underlying software that enables these services needs to able to deal with any system configuration available in the field. These requirements may lead to an increased level of embedded system complexity if not managed properly.
- Hardware and software compatibility. In embedded systems, hardware and software development needs to be synchronized. This entails several complications. One is that a certain maturity of electronics hardware is required for software development to be meaningful. This can be circumvented via virtualization—in other words, the use of model-in-the-loop (MiL), software-in-the-loop (SiL), or virtual hardware-in-the-loop (vHiL) techniques. However, virtualization itself poses additional complications for the toolchain, such as the need for hypervisors and a fine-grained configuration of security and permission aspects—that is, the need to implement, configure, and maintain the required HiL, SiL, and MiL environment—to reap its full benefits. Another complication is that the two major development paradigms (waterfall development for hardware and agile for software) need to be combined in modern systems engineering. This combination encompasses processes, methods, tools, and organizational structures, which can prove complex and challenging, because many organizations are still new to these kind of paradigms on a broader scope.
- Constraints on implementation.The development of embedded systems is subject to multiple constraints. These include technical constraints—such as energy supply, physical space, signal round-trip times, and computing and memory capacity—as well as business constraints, such as cost. These drive complexity because embedded systems need to deliver functionality to customers while staying within the bounds of these requirements.
The biggest problem in the development and maintenance of large-scale software systems is complexity—large systems are hard to understand.
Peter Marks and Ben Moseley (Out of the tar pit, 2006)
The software and electronic architecture of modern cars provides a good example of the rising complexity of embedded systems. A typical car has about 100 control units, thousands of software components, and tens of thousands of signals exchanged between subsystems. All of these need to be designed, developed, integrated, tested, and validated to work individually as well as in conjunction with each other. The average complexity of individual software projects in the automotive industry has grown by 300 percent over the past decade (Exhibit 2).
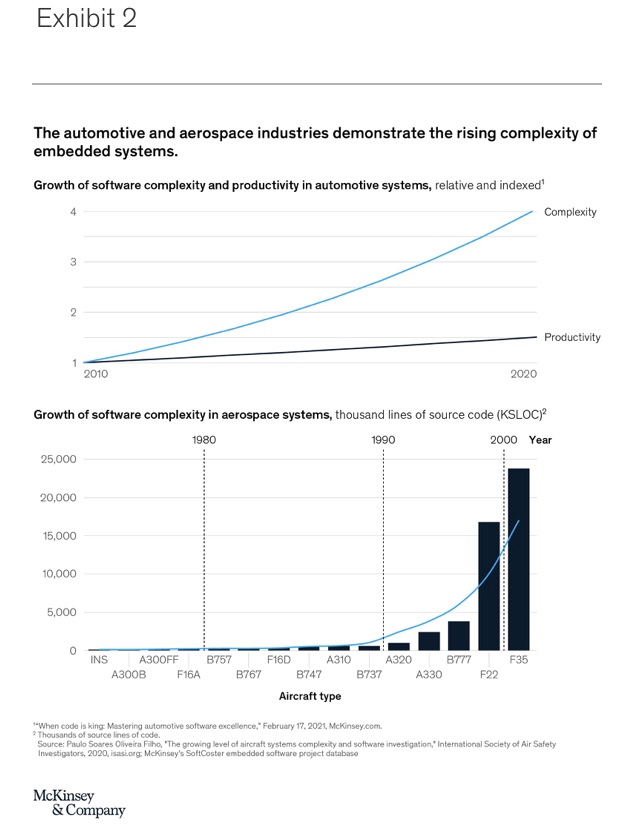
A similar trajectory can be seen in other industries, such as aerospace. The number of lines of code embedded in aircraft over the past decades has risen dramatically, another indicator of growing complexity. This growth is likely to accelerate amid rising demands for more complex functionality and for increased flexibility to update software as needed.
Failing to deal appropriately with complexity—with potentially disastrous effects
Sidebar
Defining complexity
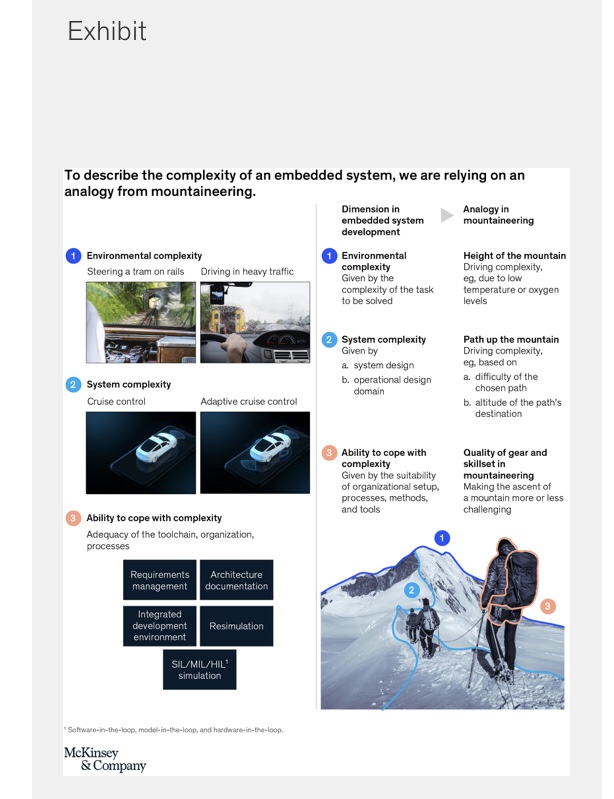
In the following, the three dimensions of complexity are defined. We use the analogy of mountaineering or mountain climbing as a means to illustrate those dimensions. This analogy helps with making the dimensions more memorable and facilitating further discussions. The exhibit below illustrates this analogy graphically.
Environmental complexityrefers to the complexity that a specific environment imposes on the embedded system’s task. It is similar to what is called “essential complexity” in software engineering—that is, the complexity that is essential to the task being solved—which is why it is treated here as externally “given” for a specific embedded-system-development project. Environmental complexity can be very high, as is the case for vehicles capable of highly automated driving. They must be able to handle such a large number of varied real-world scenarios that it is impossible to provide concrete instructions to solve every single one separately.
In comparison, environment complexity for the control system of a tram on a track is relatively low. This is because the tram’s environment is largely determined by the track itself—the length of straight and curved segments, railroad signals, and so on. Within this environment, trams have only limited freedom of movement, greatly limiting potential movement scenarios.
In the mountaineering analogy, environmental complexity is represented by the total height of the mountain. It is a fixed variable that determines the overall difficulty of the project.
System complexity refers to how many elements of a given environment a system must respond to and how complex the system itself must be.
System complexity is largely driven by two elements. The first element is the operational design domain (ODD), which is the scope of environmental complexity to be addressed by the system. For example, in the case of automated driving, the ODD, and therefore the scope of the functionality, can be restricted to sunny weather. This reduces system complexity because the system will not have to deal with limited visibility from heavy rain or fog.
The second element is the system design: the design choices within the system architecture, the technical solutions used to build certain functionalities, and the use of standards. For example, an advanced driver-assistance system could use only cameras, or it could use a combination of multiple sensor types, such as cameras, light detection and ranging (LiDAR) devices, and radar. In software engineering, system complexity beyond what is absolutely necessary is usually referred to as accidental complexity—the complexity that is unintentionally added to the project. This is often due to conscious and unconscious choices made by the system development team. Therefore, unlike environmental complexity, system complexity is never a given, so it can be minimized via smart design choices.
To continue the mountaineering analogy, system complexity could be likened to the path chosen to reach a certain destination on the mountain. Choosing a specific destination on the mountain, whether the peak or elsewhere, is similar to limiting the operational design domain. Then, to reach the chosen destination, it is possible to follow different routes, some of them more challenging than others. This is analogous to system design choices leading to lower or higher levels of complexity.
The ability to cope with complexity relates to a company’s internal capability of effectively and efficiently handling a given level of system complexity. This capability depends on the functionality of a company’s processes, methods, and tools, as well as on its organization. Well-performing companies are those that, for example, use tools that create in-depth transparency regarding embedded systems, ensure end-to-end traceability of requirements, and enable prototype-free testing.
A company’s ability to cope with a given level of system complexity can be compared with the quality of a team of mountaineers attempting to climb a mountain: their level of training (methods), their ability to function as a team (organization and way of working), and the effectiveness of their gear (tools) all play a part in determining whether or not they will be effective and efficient in reaching their goal.
Examples from the media provide plenty of accounts of the detrimental results of improperly managed complexity. These include launch delays of several months, costly recalls, enormous budget overruns, dissatisfied customers, and even safety issues. It has been estimated that a one-month delay in start of production (SOP) in the automotive industry can result in a loss of more than €100 million in earnings before interest and taxes (EBIT) for the largest OEMs. At the same time, research-and-development-budget overruns of 30 to 50 percent are not uncommon.
To understand why companies fail to properly manage complexity, leaders need to consider the following three dimensions of holistic complexity management: environmental complexity, system complexity, and the ability to cope with complexity (see sidebar “Defining complexity”).
Dimensions of complexity
Environmental complexity is determined by the environment in which the embedded system is to fulfill its tasks. If, for example, the task is to create a system for fly-by-wire operations for an airplane, the physical conditions of the airspace, air traffic participants and their behaviors, and the unchangeable parts of airport infrastructure are all drivers of environmental complexity. Environmental complexity is a boundary condition. Hence, system complexity and the ability to cope with complexity are the two key parameters that companies need to focus on in complexity management, as both can be changed.
System complexity is caused first by the operational design domain (ODD) and second by a system’s design. The ODD refers to the scope of the environmental issues that the system is to address. Companies often fail to put sufficient effort and thought into truly understanding the operational design domain of the problem that an embedded system is supposed to solve. The choice of an ODD is often made without a full consideration of its system-complexity implications. Taking the example of automated driving, complexity may be low if the ODD only includes sunny weather conditions. If the ODD were to include all kinds of weather conditions, the direct implications for required sensor sets and data-processing needs would likely increase system complexity.
The second cause of system complexity is system design. System design is about defining and building a system structure that is best suited to the tasks to be solved. Misguided system-design choices may lead to a highly complex architecture. In turn, this high complexity can make it impossible to implement important features such as over-the-air upgradability. For example, in automotive, historically the software and electronics architecture of vehicles used one function per control unit. With increasing interconnectedness of features, such a highly distributed architecture would render over-the-air updates nearly impossible. The root cause for misguided architecture design choices is often a lack of clear guidelines and priorities regarding what the architecture is expected to achieve.
An organization’s inability to cope with complexity is likely to have detrimental effects on embedded system development. This inability can stem from inappropriate or inefficient processes, methods, and tools—or even structural flaws within the organization itself. Symptoms of such an inability are evident when, for example, the interconnectedness of components is not properly reflected in the system’s setup or in the ways of working along the development process. Other symptoms are when simple spreadsheets are used to map the dependencies of highly complex systems or when static slides are used to represent system architectures. This can result in issues along the entire development process. For example, system integration can fail if component interdependencies become extremely complex or if proper tooling is not available. At the core of this inability to cope with complexity is usually a company’s unwillingness to pay—or even to acknowledge—the technical debt that often emerges when developing increasingly complex embedded systems.
Assessing a company’s ability to manage complexity
System complexity and the ability to cope with complexity are the two dimensions of complexity that a company can influence and, hence, are of key importance. In contrast, environmental complexity is considered a given. When taking these factors into account, one can derive what we have termed “the complexity management effectiveness matrix,” which provides a quick way to determine a company’s ability to manage complexity and, from there, to plan next steps (Exhibit 3).
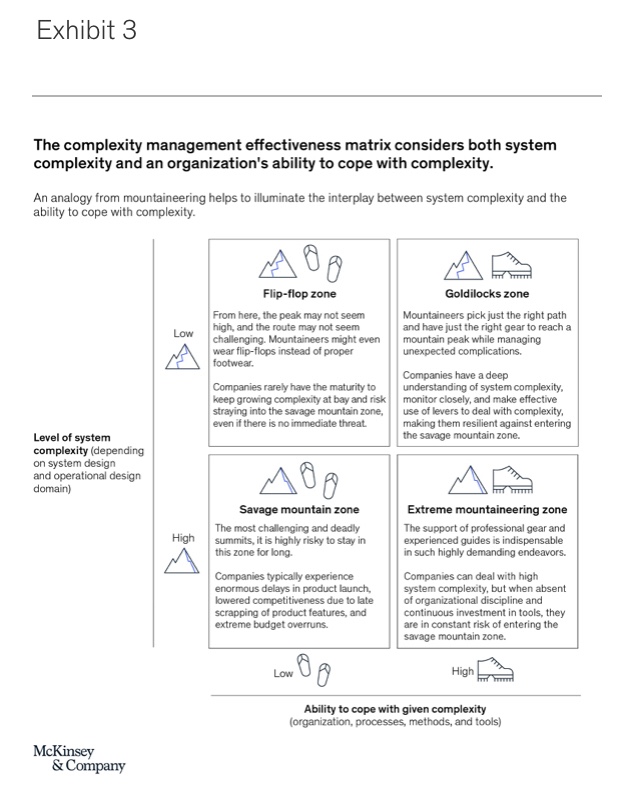
System complexity is shown on the vertical axis, and the ability to cope with complexity is shown on the horizontal axis. For the sake of simplicity, the complexity management effectiveness matrix is separated into four zones whose names are based on a mountaineering analogy (see sidebar “Defining complexity”).
- Savage mountain zone (high level of system complexity, low ability to cope with given complexity): The savage mountain is a nickname for K2, the second-highest mountain on Earth and one of the most challenging and deadly summits in the world. It is highly risky to stay in this zone for long. If we map this metaphor onto embedded system development, system complexity—the developer’s chosen path and destination—is high due to very demanding functional requirements with a poor implementation concept, a high number of variants, bad architecture choices, and so on. At the same time, a company’s ability to cope with complexity via its organizational structure, processes, methods, and tools is too low for successful project execution. This can be due to tools without automated interfaces, a lack of discipline regarding continuous critical-path analysis and debottlenecking, or bad choices on suppliers of software and traditionally hardware-focused players solely based on the individual component cost without taking a larger, long-term perspective into consideration. In the savage mountain zone, companies typically experience enormous delays in product launch, lowered competitiveness due to late scrapping of product features, and extreme budget overruns.
- Extreme mountaineering zone(high level of system complexity, high ability to cope with given complexity): The support of professional mountain guides is indispensable for people attempting mountaineering in the extreme conditions of the highest mountains. These guides are the backbone of success in such highly demanding endeavors. A similar trend becomes apparent when we consider embedded system development. In the extreme mountaineering zone of development, system complexity is high, often because the problem to be solved is very complex, such as in autonomous-vehicle development, yet architecture choices may be suboptimal. To compensate, companies in this zone have built proper processes, methods, tools, and organizational structures that support their ability to deal with the intricacies of their embedded systems in an appropriate way. They have paid their technical debt sufficiently early by installing the proper processes and methods in their organization—for example, by investing in a state-of-the-art toolchain or by modeling software-function interdependencies across the entire stack. Companies in the extreme mountaineering zone have found the means necessary to survive in a high-system-complexity situation—but at high cost. They also run the constant risk of transgressing into the savage mountain zone when high organizational discipline and continuous investment in tools and talent are not secured.
- Flip-flop zone (low level of system complexity, low ability to cope with given complexity): At the foot of the mountain, the peak may not seem high, and the path toward it may not seem challenging. In this situation, mountaineers might dare to ascend with limited gear, possibly even wearing flip-flops instead of proper footwear. In this combination, accidents occur, and reports of hikers found in dire situations are not uncommon. Likewise, in embedded system development, it is easy to fall for the misconception that when system complexity is low—for example, when following standard, well-working architecture approaches—investment in proper processes, methods, and tools, along with organizational measures, is not crucial. However, given the trends of increasingly demanding system requirements and growing system interconnectedness, this approach will only work in the short term—if at all. Companies in this zone rarely have the maturity to keep growing complexity at bay and therefore risk straying into the savage mountain zone, even if there is no immediately apparent threat.
- Goldilocks zone (low level of system complexity, high ability to cope with given complexity): Ideally, mountaineers pick just the right path to a mountain peak and tackle it with just the right gear that will allow them to safely and efficiently reach their desired destination while managing unexpected complications. In the Goldilocks zone of complexity management effectiveness, companies benefit from both a consciously limited system complexity and a high ability to cope with almost any level of complexity. This makes companies in the Goldilocks zone unlikely to enter the savage mountain zone. They have a deep understanding of system complexity drivers, monitor them closely, and make effective use of levers to keep system complexity low. What’s more, their organization, processes, methods, and tools give them the flexibility to deal with current and future system complexity.
The complexity management effectiveness matrix can be used for an initial assessment of a company’s ability to manage complexity for a given embedded system project. For a more thorough assessment, companies need to apply a complexity management effectiveness diagnostic.
Additional risks for companies with a traditional hardware-product perspective
The risk of falling into the complexity trap of embedded system development is high when overconfidence in one’s own abilities is paired with immaturity. Companies with a strong history of successfully developing and delivering hardware-focused products are prone to this pitfall. They tend to have tailored processes and world-class engineering teams able to develop very complex hardware products at the highest quality. From a pure hardware-development perspective, these companies are either in the Goldilocks zone or in the extreme mountaineering zone. This may convince them that they are able to develop virtually anything—even beyond hardware. Especially if these companies have had early successes in the development of simple embedded systems, their immaturity may be concealed.
Such companies tend to apply similar processes and management methods to embedded system development as they do to hardware development. Companies fall into the complexity trap not only because of challenges within the embedded system development process but also because of adjacent functions and the mindset, culture, and capabilities of the involved organizational units.
Complexity traps in embedded system development come in many shapes and sizes. Common examples include the following:
- The company’s organization is optimized for a different product. The established product-development organization is structured around hardware components rather than around systems and their interdependencies. This setup limits development efficiency—for example, in integration and bug-fixing—if organizational units with responsibility for subsystems that technologically have tight linkages do not collaborate closely. Worse, it may also lead to inferior system design.
- Misguided mindset. The mindset that task forces can solve any problem, even in the late-development stage, may have proved successful in classical, mechanical systems-focused development. However, in embedded-system-development efforts, the same “more people, more pressure” mindset may prove disastrous. Especially architecture-related design choices made early in the development process cannot be revoked due to the great number of interdependencies among software and hardware systems and subsystems. After a certain point, starting from scratch or living with the consequences of subpar architecture design may prove to be the only option.
- Improper development technology and processes.Engineering IT systems and toolchains are designed for hardware-centric development processes. Simply adding a software-development toolchain without proper integration is usually insufficient because hardware and software are closely interlinked in embedded systems. Hardware-centric toolchains are mostly not suited to deal with embedded-system-specific demands, such as handling tens of thousands of interdependencies, software versioning, and end-to-end requirements traceability.
- Myopia in supplier selection.Suppliers are selected purely on cost, rather than on their own maturity in complexity management as measured, for example, by their history of providing high-quality complex subsystems on time. There also may be overreliance on suppliers, which may cause or be caused by company capabilities in embedded system development, integration, and testing that are too limited to handle these activities appropriately.
- Poorly adjusted finance methodologies. Financial steering of product development may be optimized for hardware development. When the same methods are transferred to embedded systems, the impact is often negative. For example, hardware-focused financial steering often lacks a total-cost-of-ownership (TCO) perspective. Instead, short-term cost savings are typically encouraged, even when the solution requires a long-term cost perspective that incorporates the cost impact of continuously maintaining and updating a potentially complex system architecture. Another example is optimization of direct cost, which is more easily measured but is not able to capture the full extent of development costs and system complexity. This typically results in additional system variants based on components that are cheaper but that perform worse, thus raising system complexity. In addition, the potential benefits of providing functions on demand, which would require components with better performance, are not sufficiently considered.
- Marketability over engineerability. Sales departments often ask for a large set of system variants to cater to the needs of various customer segments and to remain competitive. However, this is done without paying attention to the additional effort required for development, integration, or testing of one more variant. In the worst case, adding more system variants causes product launches to be delayed by months or even years, decreasing customer satisfaction and competitiveness.
In this chapter, we have seen different forms of complexity and described their related analogy in mountaineering to better grasp the way they manifest in practice and their impact. Let us now turn to the question of how one may deal with them in the best manner, having identified their origin.
2. How to escape the complexity trap
Sidebar
Four strategies for managing complexity
Avoid. Avoiding complexity refers to preventing complexity from the start of embedded system development, as well as to limiting the introduction of additional complexity during development. This can include taking a design-simplicity approach or restricting the operational design domain in a minimum-viable-product (MVP) approach.
Reduce and drop. In a reduce-and-drop strategy, companies deliberately remove complexity—either from an embedded system already in development or from the processes, methods, tools, and organization itself. For example, companies can reduce the scope of a project, remove architecture variants, standardize hardware and software (HW/SW) and development toolchains, and remove organizational interfaces.
Contain and delegate. The contain-and-delegate strategy begins with separating a particularly complex subsystem from the rest of the system to limit interference. Development of that subsystem can then be delegated to a different entity that is better suited to develop it. For instance, a company could build a wrapper around a subsystem and then task a specialized supplier that has a strong track record with its development.
Monitor and manage. In the monitor-and-manage approach, a company does not change the current level of complexity but rather deals with it in the most efficient way. This means monitoring any expected changes in complexity so as to trigger appropriate application of the other three strategies. It also means managing unavoidable or irreducible complexity—for example, by using appropriate tools.
As discussed previously, complexity in embedded system development is undoubtedly increasing. Hence, the question arises of which strategies are most effective to escape the complexity trap and move to the Goldilocks zone. Generally, there are four strategies for managing complexity effectively: avoid, reduce and drop, contain and delegate, and monitor and manage (see sidebar “Four strategies for managing complexity”).
Strategies for complexity management
For each of the four complexity management strategies, different levers can be identified. In the following, we review key levers and provide examples.
Avoid
System complexity can be avoided by preventing it from the start of an embedded system development project and by ensuring it does not grow further during development. System complexity can be prevented from the start by picking a proper operational design domain that balances complexity with the fulfillment of customer requirements. It is also critical to assess the long-term impact of each design choice on system complexity. Often, this involves architectural considerations such as the use of specific hardware platforms, processor architectures, hardware and software (HW/SW) standardization, modularization and microservices, and the level of distribution of functionality across the logical architecture.
Complexity can also be avoided by using the proper methods, tools, and organizational setup from the start of embedded system development. From a methods and tool perspective, one can avoid complexity by using domain-driven design, enforcing a ubiquitous language, setting proper design guidelines for systems and components, avoiding the use of different tools for the same purpose, and applying agile principles.
This last point—applying agile principles—can help not only in development but also in customer experience. For example, early on, one can jointly iterate customer requirements with customers. This may allow customers to let go of some of their requirements—ideally, those that do not add much value from a customer perspective but that greatly drive complexity.
Standardization of tools, tool interfaces, and data models may also be employed to avoid complexity. From an organizational perspective, complexity can be avoided by designing the organization around systems that are strongly coupled with each other to drive efficient interactions and aligned development objectives. Organizational complexity can also be avoided by designing processes around supplier interaction such that they foster efficient collaboration.
Intuitively, it is clear that the described levers work well in a greenfield setting with many degrees of freedom. Even in brownfield settings—when embedded system development has progressed significantly, the current project needs to build upon a previous project, or organizational setup and tools are predefined—the avoidance strategy can be applied to limit complexity from growing further. In this case, the avoidance strategy needs to go hand in hand with the reduce-and-drop strategy (see below). For example, when standardization is applied to avoid further complexity growth, existing software code often needs to be refactored so that the standard is applied consistently.
Reduce and drop
In the reduce-and-drop strategy, typical levers that address system complexity are the following: reduction of variants, use of standards, reuse of code, and dropping of requirements that strongly drive complexity. Reduction of hardware variants is a powerful lever since each additional variant drives complexity and effort for development, integration, and testing. Hardware variants are often introduced to capture specific regional requirements or to technically separate high-end and low-end functionality to reduce material cost. Software variants, on the other hand, may represent a suitable means for achieving functional differentiation without raising complexity if functional decoupling is achieved or if variance can be achieved by flag-based deactivation of certain parts of a fully fleshed-out code base.
Standardization reduces complexity because it enables a common architecture and interfaces that foster code reuse and faster localization and fixing of errors. Standardization can either refer to internal standardization—for example, by choosing a standard for communication—or to externally defined standards that are shared across many players in the same industry. But when external standards are used, they need to be suitable for the task at hand to prevent the introduction of further complexity (for example, by avoiding the application of a rather heavyweight standardized middleware, such as AUTOSAR in automotive, to a simple task).
Having the proper processes, methods, and tools within an organization can also reduce or even eliminate complexity within embedded system development. Example levers are standardization of development tools, reduction of manual tool interfaces, removal of organizational interfaces, introduction of a TCO-based controlling logic, and benchmarking requirements against competitors.
Just like standardization within embedded systems, standardization of the development toolchain is an effective means of reducing complexity. Standardized tools allow for more efficient collaboration and faster data exchange. TCO-based business-case logic can be applied to support decision making on variant reduction by considering the financial effects of additional hardware variants on development effort or on product launches. Product launch delays due to the development of another variant are not uncommon, especially if bottleneck resources are required.
Having the proper processes, methods, and tools within an organization can also reduce or even eliminate complexity within embedded system development.
A typical obstacle to dropping a hardware variant is that savings in development effort do not justify the potential of additional material cost. In these situations, cost-of-launch delay may become a decisive factor, especially if important launch deadlines, such as Christmas, need to be met.
Contain and delegate
In the contain-and-delegate strategy, a company first contains complexity and then delegates it, handing it off to a specialized party. A component of an embedded system can be contained by decoupling it from the rest of the embedded system, effectively encapsulating it. A variety of options then exist to handle it, such as putting it into a separate project or release train that may follow its own release cycle without interfering with the timeline of the main project.
The decoupled or encapsulated part of the embedded system can ideally be treated like a black box with respect to other system components. While this part is still in development, stable application programming interfaces (APIs) between the encapsulated part and the remainder of the embedded system need to be provided to allow the full system to be integrated for testing purposes even in an unfinished state.
Once a complex part of an embedded system is contained, another entity, such as a specialized unit or supplier, can be delegated to handle it. This specialized entity may have greater experience, more specialized resources, or better tools. However, even though the contained part may be better handled by a different entity, this also creates additional organizational complexity.
Another option is to deal with the complex part at a later point in time. In this way, development of certain complex features can be deferred without having to postpone the start of production. This approach works best if the features in question are not crucial from a customer perspective and don’t need to be available from the start. Moreover, if remote updating of the embedded system is an option, this may not even be an issue.
Monitor and manage
Monitoring and managing complexity is required to enable all other strategies. This strategy aims to create transparency around the current level of complexity, to monitor any unwanted rise in complexity, and to establish an integrated set of processes, methods, and tools along the full development process to master complexity. A clear perspective on complexity drivers is a prerequisite for this strategy. To provide a holistic view, this perspective must cover not only the embedded system and its various layers (for example, software, electronics, and the network) but also the complexity drivers related to the organization, processes, methods, and tools.
Concrete levers within the monitor-and-manage strategy include integration planning based on holistic modeling of interdependencies, use of standardized tools to monitor complexity drivers (for example, code quality metrics), use of agile principles, and rigorous application of software-development-excellence practices, such as continuous integration and deployment (CI/CD), test automation, and performance management.
To ensure timely delivery of embedded systems, many organizations have built a single source of truth to integrate planning of large-scale embedded-system projects. The foundation of integration planning is a holistic model of system component dependencies, including how the system depends on the tools and processes needed to complete each step of system and component integration.
Clarifying and tracking dependencies enables integration planners to define when a specific piece of software, tool, or process has to be provided so that subsequent integration steps are not delayed. Graph databases are well suited for this kind of interdependency modeling, as the connections (lines) between individual elements (nodes) correspond to a certain type of dependency; for example, different types of lines may signify “is built upon,” “requires for testing,” or some other type of dependency. This property is typically not present in relational databases, especially not in such a visually obvious manner. Making these interdependencies apparent provides the foundation for previously mentioned levers in embedded system complexity management, such as decoupling in the contain-and-delegate strategy.
Organizational agility and agile ways of working also greatly help with managing complexity. Organizational agility can allow a company to quickly set up development teams whose scope and capabilities are tailored to a specific part of an embedded system. Agile ways of working, such as iterative builds and feature prioritization, enable fast reactions to rising complexity, particularly when combined with complexity monitoring. When applied correctly, these techniques uncover complexity and allow teams to adjust the scope and objectives of sprints to limit complexity with relative flexibility. Ideally, monitor-and-manage approaches are used in combination with one or more of the other complexity management strategies.
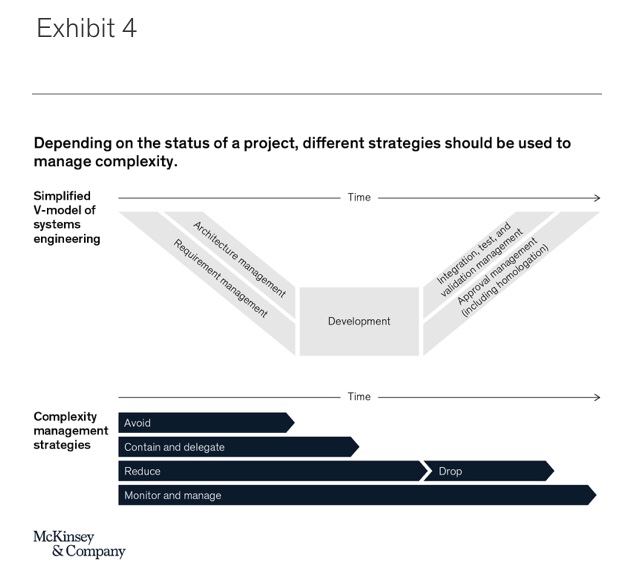
Applying complexity management strategies
It is best to use each of the four complexity management strategies and their associated levers at specific stages of the product or project development cycle (Exhibit 4). The avoidance and contain-and-delegate strategies are most useful during early project stages, when requirement engineering and architecture design are taking place. Avoiding and containing complexity early on is vital, since some system design choices are nearly impossible to revert later on in the development process. The reduce-and-drop strategy may be used throughout embedded system development projects, but some specific levers lose their effectiveness in later stages of development—for example, because a lot of development resources have already been invested on a particular functional component and other elements rely on it due to a given architectural blueprint. Finally, due to its fundamental role, monitoring and managing complexity remains relevant throughout the whole development cycle.
Outside of individual products or projects, it is important to identify a suitable way to integrate complexity management into the organization itself. Given the far-reaching consequences of improperly managed complexity, such as budget overruns, launch delays, and feature cancelations, the topic should be top of mind for any manager and team member within the product development organization, as well as for adjacent organizations, such as product management and controlling. Especially in the early phases of embedded system development, close attention to minimizing system complexity and maximizing the ability to cope with complexity is of utmost importance. This is a combined responsibility of a cross-functional team, typically consisting of members from product management, R&D, controlling, sales, procurement, and IT.
Larger organizations often establish dedicated teams that are specifically tasked with complexity management based on the four described strategies. Despite their dedicated roles, these teams require close collaboration with and support from all involved parties in the R&D process to ensure the effectiveness of all complexity management levers. Complexity management and its benefits need to be deeply engraved in a company’s mindset.
Especially in the early phases of embedded system development, close attention to minimizing system complexity and maximizing the ability to cope with complexity is of utmost importance.
Properly managing complexity in embedded systems is critical. By applying proper strategies, this difficult task becomes doable. To return to the analogy of mountaineering, the guidelines for managing complexity are straightforward to learn but tricky to master: plan carefully and follow the right path, make sure to have the right gear with you, and—most of all—know where and when to stop the ascent to greater heights.
3. Embarking on the complexity management journey
When embarking on the complexity management journey, the first step is an honest evaluation of one’s current position in the complexity management effectiveness matrix (see Exhibit 3). This needs to be accompanied by a thorough understanding of which drivers of complexity most affect the journey. Based on these initial diagnostics, one can derive concrete improvement levers that fall into one of the four strategies described in the previous chapter. Then, rigorously applying these levers is crucial to keeping complexity manageable.
Determining the starting point in complexity management
The first step in determining one’s position in the complexity management matrix is defining the relevant scope in consideration. Is it a single embedded-system-development project, or is it a portfolio of projects? The following is mostly focused on a single yet extensive project, but it can easily be extended to a full portfolio of projects. For an initial positioning in one of the zones in the complexity management effectiveness matrix, the perspective from leaders in the development organization provides a good first indication. However, for a thorough diagnosis, a systematic analysis covering the dimensions of complexity—that is, environmental complexity, system complexity (incorporating both system design and ODD), and ability to cope with complexity—is needed (see sidebar “Defining complexity”). For each dimension, it is important to go deeper and consider the key drivers of complexity.
The following are some examples of drivers (see also chapter 1 for a broader overview of complexity drivers):
- Environmental complexity: the degrees of freedom (for example, movement) and breadth of corner cases to be considered
- System complexity: the number and quality of requirements, number of variants, and degree of reuse and standardization
- Ability to cope with complexity: the level of toolchain integration and standardization, level of collaboration, team structure, or use of agile development practices
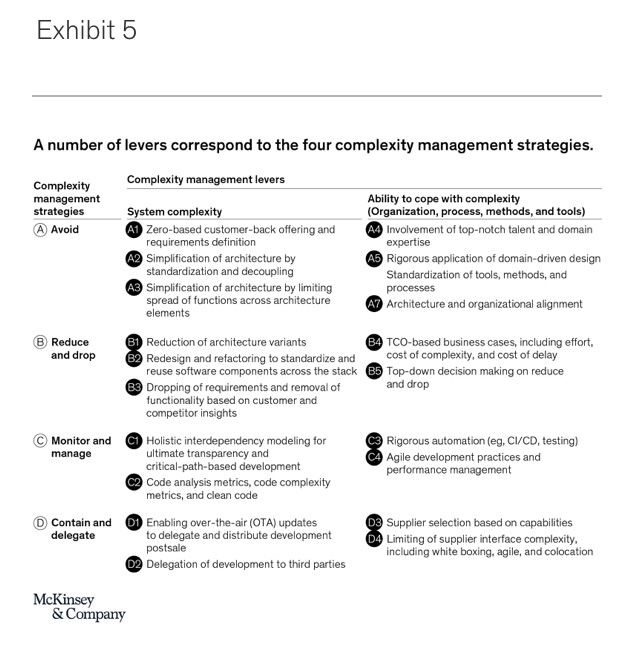
Once it is clear whether current issues come mostly from system complexity (extreme mountaineering zone), ability to cope with complexity (flip flop zone), or both (savage mountain zone)—assuming that environmental complexity is largely given—the proper strategies and levers need to be picked. Exhibit 5 provides an overview of the complexity management strategies and associated levers structured along system complexity and ability to cope with complexity. Note that the list of levers is not exhaustive but rather provides a starting point that needs to be adapted to the situation of a specific organization.
Applying complexity management strategies and levers: System complexity
In the extreme mountaineering and savage mountain zones, managing system complexity is key. There are specific levers defined along the four key strategies.
Avoid
- A1. Zero-based customer-back offering and requirements definition. Requirement overflow, especially when multiple product management organizations with different customer groups are involved, is a common driver for complexity. Minimizing requirements to what is necessary (for example, from a legal perspective) and what is key for customers can help avoid complexity altogether. The impact can clearly be huge, as some potentially costly features—that due to their complexity might never have hit the market—are not even developed.
- A2. Simplification of architecture by standardization and decoupling. When different organizational units work on an embedded system architecture, they tend to employ their preferred software components—for example, for communication protocols or for middleware. This increases complexity, for instance in testing or for bridging between different protocols. Enforcing architecture standards that require using exactly the same middleware or communication protocol across different control units helps avoid this complexity. Similarly, strong coupling of individual modules in an architecture drives complexity because changes in one module usually have a strong impact on the other, as well. Building an architecture with decoupled modules and standardized interfaces, on the other hand, enhances reuse and allows individual module teams to work largely independently. This limits complexity in their work, as the need for alignment teams working on other modules is lowered. The effect of proper modularization alone can be huge: one organization that embarked on a rigorous architecture modularization program was able to cut software development and support costs by 25 percent.
- A3. Simplification of architecture by limiting spread of functions across architecture elements. For reasons such as limiting the necessary processing power of individual control units, functions are sometimes spread across multiple modules. This is especially the case in architectures where low-performance and high-performance variants have been introduced. Functions that were allocated to a single high-performance control unit in one variant need to distributed across several control units in the other architecture variant in which the high-performance control unit does not exist. This greatly drives complexity of interfaces and raises development and testing effort. Thus, avoiding this practice of spreading functionalities or removing variants altogether (see lever B1) is a key enabler of development efficiency and reduced cost.
Reduce and drop
- B1. Reduction of architecture variants. New architecture variants quickly emerge—for example, when separating high-end and low-end functionality or due to regional specifics. Variants drive additional effort especially in testing and validation, as often individual variants need to be tested and validated separately. Gaining transparency on these variants and systematically removing those not absolutely necessary is a key lever for reducing complexity. For one organization, the reduction of a variant meant freeing up bottleneck resources that otherwise would have been occupied with validation and testing of that variant. Due to the variant’s removal, the overall validation and testing timeline could be accelerated by 1 to 5 percent.
- B2. Redesign and refactoring to standardize and reuse software components across the stack. It is common that during development new requirements emerge or cost pressure and a lack of strict governance result in nonadherence to architecture design guidelines. The result is an increase in largely unnecessary system complexity. Redesigning some architecture elements and refactoring code may become necessary. This allows for standardizing, modularizing, or enforcing code reuse in systems whose development has already progressed. As redesign and refactoring can be time consuming, the benefits of standardization, modularization, and reuse should be weighed against required effort and prioritized accordingly. Before the application of redesign and refactoring, 85 percent of one organization’s modules contained custom code. After the change, 60 percent of modules were identical, and only 5 percent had custom code. As a result, product configuration cost could be reduced by 10 to 15 percent, and cost in support and maintenance was lowered by 15 to 20 percent.
- B3. Dropping of requirements and removal of functionality based on customer and competitor insights. Delayed development timelines are often caused by new project requirements or an underestimation of the complexity of realizing some of the initial requirements. In this case, dropping some of these requirements or even removing full functionalities may be inevitable to reduce complexity and allow delivery of the embedded system in time and in quality. To identify those requirements or functionalities best suited for removal, prioritization is needed. Key criteria include requirement complexity, the potential effort that nondevelopment of a functionality may entail, and customer impact. To determine the latter, it is necessary to develop both a clear perspective on expected customer needs, as well as continuous benchmarking of planned and currently developed functionalities against today’s competitor offerings and those expected in the future. Dropping requirements and functionalities can be a great yet somewhat risky lever for reducing complexity. If critical deadlines for product launch, such as Christmas, need to be met, this may even be the only way.
Monitor and manage
- C1. Holistic interdependency modeling for ultimate transparency and critical-path-based development. A key driver of complexity is the number of interfaces and dependencies among components in an embedded system and also their relation to tools such as test instances. If interdependencies are not properly documented, adverse effects—for example, on testing and validation—can be enormous. The first step toward managing interdependencies is creating transparency—regarding both the components that depend on each other and the specific tools the development timeline depends on, such as those used for simulation and testing. Once interdependencies are fully transparent, for example, bottlenecks in the development process, root causes for failed test cases, and subsystems contributing most to overall complexity can be identified. Based on these insights, a number of levers, such as B1 or B2, can be applied in a much more targeted way.In addition, transparency on interdependencies enables critical-path analysis. The critical path reflects the longest sequence of tasks the completion of which is required to finish development. Development following the critical path makes sure that more fundamental subsystems upon which the customer-facing functionalities depend are developed first. Also, in case of errors, these can be more easily located based on the interdependency map. The effect of a holistic interdependency analysis combined with rigorous system development following the critical path can be huge. For an organization whose market launch of its key new product was at stake, the development timeline could be shortened by 10 percent by strictly following a critical-path-based development order for software components.
- C2. Code analysis metrics, code complexity metrics, and clean code. There are a number of quality standards and coding best practices when it comes to software development. These aim to ensure that code is developed in a readable, clean way, fostering intuitive understanding. Multiple of such practices are summarized by the term “clean code”3 and encompass, for example, principles for formatting source code or for naming code elements. Several metrics, such as cyclomatic complexity, can be used to assess the complexity of code and therefore allow for the creation of a targeted view of potential complexity reductions. Rigorous application of these standards and best practices lowers complexity, facilitates code reuse, and improves collaboration across teams. Functionalities for measuring code quality are typically built into modern integrated development environments and, hence, are readily available.
Contain and delegate
- D1. Enabling over-the-air (OTA) updates to delegate and distribute development postsale. When development timelines are tight due the burden of complexity, the ability to conduct OTA updates across all architectural layers postsale can prove to be a safety anchor. In case a certain requirement or functionality needs to be scrapped during initial development to meet deadlines, OTA updates allow them to be readded even after the product has already been sold. From this perspective, OTA updates buy additional development time that may be direly needed in case no other way of dealing with complexity was successful.
- D2. Delegation of development to third parties. For developing highly specialized subsystems of an embedded system, specific capabilities may be required. Autonomous driving subsystems with capability needs around image recognition and path planning are a good example of this. In such cases, delegating development to a specialized unit or a third party that has better capabilities and experience than one’s own organization can aid success and be a viable strategy for managing complexity. Especially in the automotive industry, this is common practice and can be successful if certain best practices in supplier selection and collaboration model (see levers D3 and D4) are adhered to.
Applying complexity management strategies and levers: Ability to cope with complexity
In the flip flop and savage mountain zones, improving the ability to cope with complexity is key. There are specific levers defined along the four key strategies.
Avoid
- A4. Involvement of top-notch talent and domain expertise. A common driver of complexity is overspecification based on the false belief that all current and potential requirements need to be met or that an embedded system needs to reflect all environmental complexity. One root cause for this is the lack of sufficiently experienced talent and domain expertise within the team. Having experts on the teams specifically for architecture and toolchain development is critical because they can draw on their experience to determine how to resolve trade-off decisions—for example, between system complexity and cost—where to draw system boundaries in a modular architecture, or how to set up an efficient toolchain combined with a proper operating model. Deep domain expertise helps with prioritizing requirements and abstracting from environmental complexity so that overall system complexity can be kept at bay.
- A5. Rigorous application of domain-driven design. When systems are large and their development needs to be distributed across many teams this by itself adds a lot of complexity that needs to be managed. Domain-driven design4 provides a number of concepts that support dealing with these issues. Key concepts include the use of a ubiquitous language, model-driven design, or bounded context. For example, a ubiquitous language—that is, a commonly shared and strictly applied language—fosters cross-functional alignment and removes ambiguity at the interface between developers, domain experts, and users.
- A6. Standardization of tools, methods, and processes. Some software-development organizations fall into the trap of using different tools to serve the same purpose across the organization, such as for backlog management or testing. Other organizations are relying on static drawings for architecture diagrams where dynamic tools would be needed to ensure that diagrams are always up to date and to enable drill downs. All of this adds unnecessary complexity and makes managing the required complexity of the task needlessly burdensome. Hence, the simultaneous standardization of tools, methods, and processes is a key lever to improve an organization’s ability to cope with complexity. For example, one organization developing a complex embedded system lacked clarity on the progress and development speed of each module. They greatly benefitted from integrating their entire development backlog into a single tool, allowing them to quickly identify and remove bottlenecks.
- A7. Architectural and organizational alignment. If done properly, embedded system architectures are designed to facilitate systems functionality while reducing complexity to the minimum necessary level. What is often neglected, however, is that to actually develop the elements of that architecture, the structure of the embedded system development organization and the architectural structure need to be aligned. This is necessary because of Conway’s law5 : “Any organization that designs a system (defined broadly) will produce a design whose structure is a copy of the organization’s communication structure.” Hence, if there is lack of congruence between architecture and organization, the architecture that is actually implemented will follow the organization’s structure if intended or not. If architecture and organization are aligned, complexity is avoided because relevant communication partners for individual developers are clearly evident, and unnecessary communication between unrelated organizational units can be avoided. This leads to an overall increase in development efficiency.
Deep domain expertise helps with prioritizing requirements and abstracting from environmental complexity so that overall system complexity can be kept at bay.
Reduce and drop
- B4. TCO-based business cases, including effort, cost of complexity, and cost of delay.As already outlined in the first chapter, many embedded-system-development projects suffer from poorly adjusted finance methodologies. For example, current business case logic often incentivizes introduction of additional architecture variants to reduce material cost. However, the negative impact of an additional variant on system complexity, leading to increased development effort and a potential delay in product launch, is often neglected or insufficiently reflected in the business case. To counteract this, a true total cost of ownership (TCO) perspective is required. TCO not only needs to reflect all types of cost, with the full life cycle of a system extending beyond the development phase, but also risks—for example, the potential EBIT loss due to a late product launch. To make the TCO perspective work in practice, benchmark-based methods need to be in place where the effects of similar trade-offs are made transparent. The benefit of having a TCO perspective is to drive trade-off decisions that actually lower complexity.
- B5. Top-down decision making on reduce and drop. In some organizations, efforts to reduce complexity—for example, via removal requirements or reduction of the number of variants—fail repeatedly. The root cause is often that different parts of the organization cannot agree on the metrics to value the effect of measures aimed at lowering complexity. One of the last resorts in this case can be rigorous top-down decision making on complexity reduction measures, with top management taking the lead. The benefit of top-down decision making is clear: decisions taken by top management can result in fast removal of complexity. However, this approach should only be temporary until other levers for complexity management, such as a TCO perspective in business cases (see lever B4), have been fully embraced by the organization.
The simultaneous standardization of tools, methods, and processes is a key lever to improve an organization’s ability to cope with complexity.
Monitor and manage
- C4. Rigorous automation (for example, CI/CD, testing). When companies are only able to commit new code to a system every few months or so, this usually indicates that they lack toolchain automation. The result of such long iteration cycles is often that necessary but high-effort architecture changes are avoided and errors are only discovered late in development. Especially in situations with high system complexity and for large organizations, rigorous automation is a key lever for managing complexity. By installing rigorous CI/CD practices, one company was able to reduce the duration of code freeze to successful compilation of the target build from four or five days to less than half a day. Similarly, high test automation allows organizations to move into a test-and-learn model, allowing for much quicker refinement of architectures and code.
- C5. Agile development practices and performance management. Key benefits from employing agile development practices are close collaboration between development teams and users and the ability to flexibly react to changes, such as new requirements. For example, the close connection to users enables developers to focus on what the customer actually needs, rather than developing features that add complexity albeit little value. Increased flexibility through agile development allows complexity reduction to be more easily driven, even while development is ongoing. Hence, refactoring (see lever B2), for example, can be flexibly included in program increment planning—one standard agile practice—when required. In a comparison between approximately 500 development projects applying either agile or more traditional “waterfall” methodologies, agile projects showed a 27 percent higher productivity, a 30 percent better adherence to schedules, and three times fewer residual defects at launch.
Contain and delegate
- D3. Supplier selection based on capabilities. As noted in lever D2, delegating the development of a certain functionality to a third party can be powerful if that organization has better capabilities to develop it. However, in many cases, cost is the primary decision criterion when it comes to supplier selection, while the supplier’s actual execution capabilities—for example, measured by its experience in developing similar functionality as the one requested, its general development competencies, or the sophistication of its toolchain—only play a secondary role. The result of such supplier selection practices can be as disastrous as schedule delays, equivalent to several years. Alternatively, a due diligence assessment of the supplier’s competencies can be made part of the selection process to gain confidence on a supplier’s ability to deliver. This is especially relevant if the supplier is requested for the development of a critical subsystem within the embedded system upon which, for example, many other systems or critical customer-facing functions depend.
- D4. Limiting of supplier interface complexity, including white boxing, agile, and colocation. Adding an external party to the development project adds another layer of steering, thereby increasing interface complexity and lowering the ability to cope with complexity. This is, for example, because supplier steering includes the need to formulate requirements that fit the supplier’s language, to align on those requirements, and to have the supplier accept them. Additionally, the organizational boundaries to the supplier make the application of previously mentioned levers harder. Thus, a proper setup and collaboration mode with suppliers is necessary. This includes the exchange of white box code versus the use of black boxes; joint use of agile principles, such as having a common development backlog and program increments; integration of each other’s toolchains to enable seamless data exchange; using a common language; or colocation to reap the benefits of having fewer development sites. Already, the last of these can greatly drive productivity. The analysis of our software project database has shown that if the number of development sites can be reduced by one, the effect is an increase in productivity of up to 10 percent.
4. From managing complexity to mastering complexity
There is no silver bullet to complexity management, but there are strategies and levers that can be applied in appropriate situations. In getting started on the complexity management journey, the following five steps have proven to be impactful:
- Portfolio view: As a starting point, cut your R&D portfolio into projects with high and low complexity, considering both environmental complexity and system complexity. Within the set of high-complexity projects, select those that are critical from a business impact or timeline perspective. Be extra careful not to ignore high-value yet very early-stage projects because the time window for avoiding unnecessary complexity often closes quicky.
- Complexity assessment: For critical projects, conduct an honest analysis to determine in which zone in the complexity management effectiveness matrix it is to be located (see Exhibit 3). Run a deep-dive assessment along the drivers of system complexity and the drivers that limit the ability to cope with complexity. Evaluate the impact of each driver against KPIs that are critical for project success, such as life-cycle cost, time to market, competitiveness, and customer experience.
- Complexity management strategy selection: Considering the current development status of critical projects, pick the proper complexity management strategy and corresponding levers. Prioritize levers that address the drivers with the highest impact and that have the highest feasibility given the current situation of the project.
- Complexity management strategy execution: Once levers are prioritized, begin execution. Make sure to involve all relevant functions (for example, R&D, product management, sales, procurement, and finance) to foster quick alignment and drive change. Ensure top-management sponsorship and decision making to ensure efficiency in lowering system complexity and improving the ability to cope with complexity.
- Long-term change: Leverage cases of successful complexity management to derive and codify lessons learned so that next-generation projects avoid the pitfalls of the previous ones. In addition, build momentum to drive long-term change in the organization as it relates to complexity management. This should include organizational setup, operating model, tooling, and increased awareness of complexity and a cultural change. The objective is to make complexity management an integral part of the organization’s mindset, with complexity management strategies being applied rigorously.
One indicator that a company has achieved complexity management mastery is the building of effective, integrated, and end-to-end toolchains. This is because these types of toolchains allow for fast, virtual integration of the complete embedded system in short cycles; they enable quick identification and localization of errors via automated testing; and they avoid inefficient manual interfaces. One such master of complexity management is an industrial company that has built a comprehensive system-interdependency map for its software and electronics architecture, as well as a corresponding toolchain using graph databases. The transparency provided by the system-interdependency map gives company leaders the ability to identify and eventually change unwanted couplings between system components. It also allows them to reshape the organization so that systems components that require tight coupling are handled by closely collaborating units.
Mastering complexity management has multiple benefits, including reaching the Goldilocks zone. By taking complexity seriously from the start of any embedded system development effort, those embedded systems are able to fulfill challenging tasks, are developed in time, and result in high quality. This leads to satisfied customers and a stronger competitive position. Moreover, complexity management leads to happier employees who are more likely to stay with the company, as well as to increased attractiveness to new talent. Resources saved through complexity management mastery can be invested in developing the next product or in continuous updates of the embedded system with new functionality.
Complexity doesn’t have to be a purely negative factor in development. As Suzanne Heywood, Jessica Spungin, and David Turnbull wrote in “Cracking the complexity code,” complexity can be “seen as a challenge to be managed and potentially exploited, not as a problem to be eliminated.”6 They argue, rightly,
Article link: https://www.mckinsey.com/industries/advanced-electronics/our-insights/cracking-the-complexity-code-in-embedded-systems-development?
ABOUT THE AUTHOR(S)
Johannes Deichmann is a partner in McKinsey’s Stuttgart office; Georg Doll is a senior expert in the Munich office, where Jan Paul Stein is an associate partner; Benjamin Klein is an associate partner in the Berlin office; and Bernhard Mühlreiter is a partner in the Vienna office.
The authors wish to thank Nico Berhausen, Jan Brockhaus, Ondrej Burkacky, Hannes Erntell, Ruth Heuss, Christos Kapellos, Gérard Richter, Fabian Steiner, and Rupert Stuetzle for their contributions to this report.